Showing posts with label Research. Show all posts

Wednesday, February 24, 2021

Tuesday, December 29, 2020

Progress in Community Health Partnerships: Research, Education, and Action

"Influencing Public Transportation Policy Through Community Engagement and Coalition Building: Process and Preliminary Outcomes" is now available online.  

Please contact me if you would like to access the article but are unable. 

Summers, P., Chao, E., McCoy, P., Perry, J., & Rhodes, S.D. (2020). Influencing Public Transportation Policy Through Community Engagement and Coalition Building: Process and Preliminary Outcomes. Progress in Community Health Partnerships: Research, Education, and Action 14(4), 489-498. doi:10.1353/cpr.2020.0054

Monday, December 14, 2020

What a year

One year ago was my last day behind the wheel of a city bus.  It was an emotional day made sweet by singing Christmas carols.  

A lot has happened since and I am grateful for the experience I gained during 2020. 

  • Worked with City with Dwellings at the overflow homeless shelter
  • Wrote an ebook for Stakeholder Health on public transportation
  • Wrote a transit corridor report for CSEM
  • Won a bus shelter public art contest
  • Case investigation for COVID-19 for the Health Department
  • Helped take the US Census as a NRFU
  • Arrested at a Black Lives Matter Protest for John Neville
  • Returned to WFSM to do project management


Tuesday, June 9, 2020

WSTA Prominent Transit Corridors Report

Winston-Salem was once a leader in public transportation.  I believe it could be again.

Please read my WSTA Prominent Transit Corridors Report that suggests expanding bus service in historic transit corridors.

The report's data tables are online for accessibility and transparency.

Below is Map 1, which illustrates the most prominent corridors that warrant expanded service.


Wednesday, April 1, 2020

Lessons in Homelessness

Working as a night monitor with City With Dwellings taught me a lot about working with homeless people. The organization's tag line, "A Community First Initiative" drew me in and working at two different churches gave me a chance to meet many members of our community.

As the monitor, my job was to establish relationships with the guests.   I knew them by name and got to know their personalities.  I was surprised how quickly we built rapport and was also continually shocked by how quickly it could evaporate. I learned about giving and receiving forgiveness.

Below are graphics that depict the average (18.4) number of guests that stayed with me for the 25 nights I worked.  I worked from 6:30 PM to 6:30 AM on Thursdays and Sundays.   During those 12 hours I got to interact with homeless men during check-in, dinner, a smoke break, going to sleep, waking up, and departing for the day.

Any night when there were 20 guests or more was particularly challenging for managing group dynamics.  By the end of the season, working with fewer at a time seemed much more manageable, but there was still plenty of room for unexpected events.  I worked hard to maintain quiet in an effort to help the guests sleep, but an overflow homeless shelter is a menagerie of activity.


Only one guest stayed with me every night that I worked.  That means he was with me the nights in December at Redeemer Presbyterian and the 3 months at First Presbyterian.  I worked 25 nights and the average guest was with me for 4 nights.  Of the 84 guests who stayed with me almost half stayed 2 nights or less.


These numbers demonstrate the churn and turnover in guests within the overflow shelter. These numbers are a subset in two ways.    They show only 1 of 4 sites coordinated by City With Dwellings and only the nights I worked.  

The depth of relationship that the longstanding staff members have with guests is impressive.  Through the many seasons of running the overflow shelter, they have gotten to know guests who come and go.   Working with an organization that ensures no one will sleep outside in the winter was an honor and a privilege to see the depth of love demonstrated through caring relationships.   I witnessed love in action and in truth.  

Thursday, March 5, 2020

Public Works Committee Wants Your Input

Come give input on the importance of bus frequency at the public works committee meeting on Tuesday, March 17th at 6pm at City Hall.

City Council member, Dan Besse invited transit advocates to attend the public works committee to provide input.  You can watch the video of his invitation in the story "Making News."

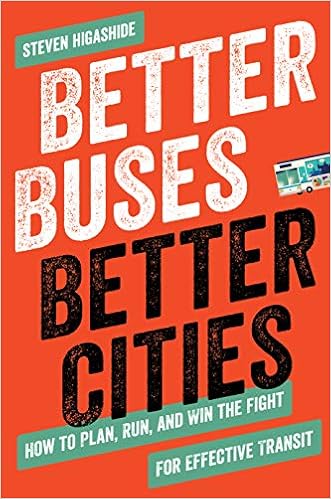
99% Invisible's podcast "Missing the Bus," has a brilliant explanation on why bus frequency is so important.  It is an interview with, Steve Higashide a transit expert, bus champion, and author of a new book called Better Buses Better Cities.

Take a look at WSTA's ride per hour of service ratio to see which routes are transporting the most people.  I believe there is a lot of latent demand on routes 92 and 96. Improved frequency on those routes would generate more rides and many corollary benefits for our community.

Come out to the public works committee meeting on Tuesday the 17th to weigh in on making our city better via improved bus frequency.

Monday, February 24, 2020

Hotel 22

I am currently working as the night monitor for the seasonal homeless shelter, City With Dwellings.  We derive our name and mission from the beautiful passage of Isaiah 58.  I love the part that says:
...and if you spend yourselves in behalf of the hungry
    and satisfy the needs of the oppressed,
then your light will rise in the darkness,
    and your night will become like the noonday.
Working with individuals experiencing homelessness has given me new gratitude for life and appreciation for the relative luxuries of homeownership.  Driving a city bus put me in contact with poverty in new ways and challenged me in how I look for ways to share that experience with others. I am eager to share the stories below.

Hotel 22 is a 24-hour bus in Silicon Vally, California. It is Valley Transit Authority Route 22 and a trip from East San Jose to Paloalto takes an hour and a half.  It got its name because homeless people ride it to seek shelter at night.

My dad heard about it on the radio and told me to look it up. I am so glad I did because I came across two great documentaries.

I was spellbound as I listened to the BBC's documentary podcast.  It made my heart hurt for the driver who is falling off the benefits cliff and trying not to lose hope.  More and more I realize that drivers deserve attention as much as passengers suffering from structural vulnerability and health inequalities. 
of
I also came across Elizabeth Lo's breathtaking documentary short film composed of experiences during a week of riding Hotel 22.  She captures an argument between passengers and it reminds me of the strife that can so quickly flare up as I monitor the homeless shelter.  The raw footage of human weariness is compelling.  It reminds me that we must See the Traveler if we want our light to shine like the noonday.  

Wednesday, January 22, 2020

FaithHealth Recording

I presented to FaithHealth today and was grateful to tell stories from the bus. 

You can hear the recording and view the slides.

Tuesday, January 21, 2020

FaithHealth Slides


Tomorrow is the big day. 

I hope you can join me to hear stories from my year of driving a city bus. I learned a lot about the social determinants of health. 

Come to the 10th Floor of the Wake Forest Baptist Health Comphrenshive Cancer Center at 9am to hear the presentation for FaithHealth

I have the slides ready to go!   

Wednesday, December 18, 2019

CV

CV is short for Curriculum Vitae, a Latin phrase meaning "course of life."

I recently updated my CV and included it as a tab on the navigation bar for easy access. My life followed an interesting course in 2019. It turned down a road of solidary with the poor and it followed a calling for radical advocacy for the expansion of public transportation to improve mobility.

As I ponder what is next professionally I feel open to what 2020 has in store.  Please check out my CV and reach out to me with job offers!

Monday, December 16, 2019

Hours, Rides, and Pay

I began working for the Winston-Salem Transit Authority on Monday, January 28th and ended my tenure on Friday, December 13th. I learned a great deal about the public health importance of public transportation during the course of the year of our Lord 2019.

I worked 2,037 hours providing an estimated 24,721 rides (hours multiplied by rides per hour ratio) and earned $26,764 in take-home pay.

The chart below shows that my hours were trending up from an average of 43.3 hours per week.  My longest week was 55.8 hours which resulted in an estimated 832 rides.

The average American works 1,811 hours in a year (TMFBookNerd).  I worked 226 hours more than that which helps me rationalize the completion of my goal of driving for a year. I logged 8 weeks of working 50 hours or more.

My income was below the federal poverty line for a family of 5.

View analysis of my hours, rides and pay online in this spreadsheet. Data comes from the ADP App of my pay stubs; any error in data entry or analysis is my own.

Wednesday, November 20, 2019

Vacation Analysis

I accrued 17 hours of vacation for 2020. It made me wonder how I compared to my fellow drivers.

Table 1 shows the breakout of allotted vacation hours by the number of drivers. You can see that the 5 most senior drivers (whom each get 6 weeks off) account for almost 15% of all the allotted vacation hours. By comparison, my classmates (4 drivers) account for .08%.  The average driver will get 80 hours of vacation in 2020.

Table 1: Vacation Allotted by 102 Drivers
Allotted HrsN Drivers% Vacation Hrs%
24054.91,200.014.6
20032.9600.07.3
1601312.72,080.025.3
1201110.81,320.016.1
9311.093.01.1
9011.090.01.1
802322.51,840.022.4
6211.062.00.8
401312.7520.06.3
36.643.9146.51.8
29.922.059.90.7
2311.023.00.3
2022.040.00.5
19.922.040.00.5
1743.968.00.8
1311.013.00.2
1022.020.00.2
711.07.00.1
01211.80.00.0
1,261.61021008,222.4100

Creating groups makes it easier to visualize the fact that 30% of the drivers do not have much vacation.

Using seniority as the primary means of bestowing benefits tilts the scale in ways new drivers feel but often lack the words to express. It works against newbies.  New drivers are doing extra work to cover for everyone else's vacation. The current policy forces them to wait to years to receive one week of vacation.

Figuring out an equitable vacation policy would reduce the high initiation burden that new drivers face.   Addressing such issues would aid in the retention of drivers.

Here is the link to the data.

Monday, November 11, 2019

Operator Survey


Alfredo and I conducted a survey of fixed-route bus drivers for their suggestions regarding routes and schedules.   Below are the tables of our findings. 


Table 1. WSTA Driver Schedule Survey N =79Total%
A ten-hour shift 4 days a week starting in the morning5772.2%
A ten-hour shift 4 days a week starting in the evening3038.0%
An early morning 8-hour straight shift 5 days a week2227.8%
A Late 8-hour straight shift 5 days a week1620.3%
Split shifts 5 days a week56.3%
Night runs with weekends off1822.8%
Provide a suggestion of a schedule810.1%


Table 2. Route Suggestions
RouteSuggestion
89More time on the route
93Route needs to be cut short
93Service Castle Heights or 331 and North Hampton Dr; Change time points on the outbound trip
95Cut out Strattford and Knollwood
99More time on the route
103Move final time point back so you can get to TC earlier
104Changing inbound time points for a bathroom break at the TC on Route 104. The new time points could be [5. Old Lexington 6:05] [6. Waughtown and Vargrave 6:10] [7. Waughtown and South Main 6:15 [1.TC 6:20].
104Adjust so you can get a bathroom break
105More time on the route
105Not go up Argonne

Saturday, November 2, 2019

Intersection

From the driver seat of the city bus, I have begun to dread coming to the intersection of Patterson and Indiana Avenues.  The intersection is the convergence of routes 87 and 92.  You can see from the ratio of rides per hour that they are our most popular routes.  These routes combined represent just over 15% of all rides. 

I am fearful for the people I see walking in this dangerous interchange.  I have seen them darting across this busy intersection to try to catch whichever bus is passing at the time. Route 87 stays on Patterson while 92 turns on Indiana.

If you go in person or take a virtual Google Maps tour of the intersection you will see pedestrians but no infrastructure for safely navigating the interchange.  The intersection is crowded with people and yet no pedestrian amenity (i.e. crosswalk, island, signal) in street design. 

Driving either of these routes is an inexhaustible source of people-watching. It is a privilege to serve the passengers in these important public transportation corridors.  I hope I never witness a person struck by a car at the intersection of Patterson and Indiana. 

Sunday, October 20, 2019

Route Ride Per Hour Ratio

The Winston-Salem Transit Authority is on course to provide over 2.5 million rides in 2019. That is a big number that can be hard to grasp.  Breaking it down by route helps it add up.

I became a bus driver to experience first hand the power of public transportation and to help me understand the complex system.  As I drive around I have been thinking of a measure to use in comparing routes.  I came to the idea of using a ratio that compares ridership per hour of service.

 Table 1: WSTA ridership per route for September 2019.
RouteDTNSDRides% RidesHrs% HrsRides/Hrs
87^NL721,54610.1633.54.434.0
92NEL611,9695.6428.03.028.0
96EL712,7986.0497.53.525.7
93EC79,7474.6475.03.320.5
91NL68,3673.9428.03.019.5
83*SL714,4976.8801.55.618.1
89NL78,6604.1481.53.418.0
86SL78,3583.9483.03.417.3
84WL66,3843.0412.02.915.5
105*SEL711,1475.2751.55.314.8
81/82WC66,1092.9416.02.914.7
103*WL710,7625.1733.55.114.7
94EL77,1563.4493.53.514.5
88NL53,5481.7260.01.813.6
102SWL51,3110.6100.00.713.1
107*WL79,1214.3713.55.012.8
106NL76,0652.8485.53.412.5
98NEL53,2451.5260.01.812.5
80*WL78,8154.1733.05.112.0
109NWL65,1052.4438.03.111.7
90NL75,7822.7497.53.511.6
85*WL67,8193.7678.04.811.5
104SL75,5012.6483.03.411.4
101SECT75,1292.4473.53.310.8
97NC63,9581.9422.03.09.4
95WL54,2892.0480.03.48.9
110EC59560.4120.00.88.0
108SC72,9711.4485.53.46.1
99WCT58350.4240.01.73.5
100AllC71,0800.5361.82.53.0
29213,03010014265.810014.9
D = Cardinal Direction | T = Type (Circular, Cross Town, Linear) | NSD = N Service Days
^ = has 2nd bus | * = 2nd Bus Funded by NCDOT B40

You can see that some of the routes are very popular and others are quiet.

I believe you can use this type of information to advocate for second buses on popular routes like 92 and 96.  For example I think the Place Matters Initiative should push for a second bus on route 96 that runs through their impact communities.  I have driven it and could feel the importance of the bus in those places.

What interesting things do you see in this information? 

This analysis is available on the web. The data was provided by the Winston-Salem Transit Authority in an email from the General Manager on 10/10/19.